
By CountingPips.com – Receive our weekly COT Reports by Email
Here are the latest charts and statistics for the Commitment of Traders (COT) data published by the Commodities Futures Trading Commission (CFTC).
The latest COT data is updated through Tuesday March 16 2021 and shows a quick view of how large traders (for-profit speculators and commercial entities) were positioned in the futures markets.
Gold Comex Futures:
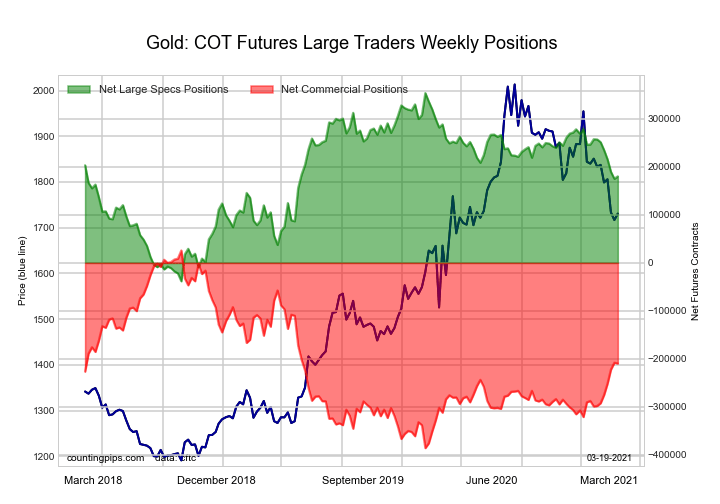
| Gold Futures Statistics | SPECULATORS | COMMERCIALS | SMALL TRADERS |
| – Percent of Open Interest Longs: | 53.8 | 24.2 | 10.6 |
| – Percent of Open Interest Shorts: | 16.0 | 68.2 | 4.5 |
| – Net Position: | 180,196 | -209,475 | 29,279 |
| – Gross Longs: | 256,237 | 115,396 | 50,576 |
| – Gross Shorts: | 76,041 | 324,871 | 21,297 |
| – Long to Short Ratio: | 3.4 to 1 | 0.4 to 1 | 2.4 to 1 |
| NET POSITION TREND: | |||
| – COT Index Score (3 Year Range Pct): | 55.7 | 42.8 | 54.6 |
| – COT Index Reading (3 Year Range): | Bullish | Bearish | Bullish |
| NET POSITION MOVEMENT INDEX: | |||
| – 6-Week Change in Strength Index: | -19.6 | 21.5 | -28.3 |
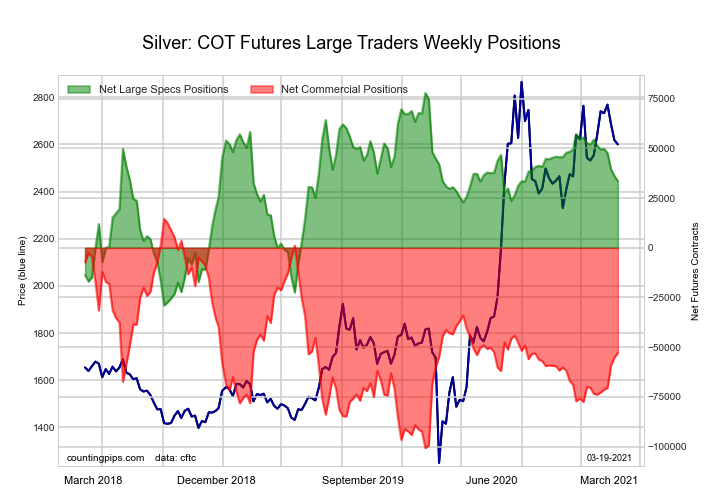
Silver Comex Futures:
Free Reports:
 Download Our Metatrader 4 Indicators – Put Our Free MetaTrader 4 Custom Indicators on your charts when you join our Weekly Newsletter
 Get our Weekly Commitment of Traders Reports - See where the biggest traders (Hedge Funds and Commercial Hedgers) are positioned in the futures markets on a weekly basis.
| Silver Futures Statistics | SPECULATORS | COMMERCIALS | SMALL TRADERS |
| – Percent of Open Interest Longs: | 44.4 | 31.5 | 19.1 |
| – Percent of Open Interest Shorts: | 23.3 | 64.7 | 7.0 |
| – Net Position: | 33,609 | -52,777 | 19,168 |
| – Gross Longs: | 70,658 | 50,087 | 30,354 |
| – Gross Shorts: | 37,049 | 102,864 | 11,186 |
| – Long to Short Ratio: | 1.9 to 1 | 0.5 to 1 | 2.7 to 1 |
| NET POSITION TREND: | |||
| – COT Index Score (3 Year Range Pct): | 58.6 | 41.6 | 52.8 |
| – COT Index Reading (3 Year Range): | Bullish | Bearish | Bullish |
| NET POSITION MOVEMENT INDEX: | |||
| – 6-Week Change in Strength Index: | -16.7 | 18.3 | -19.8 |
Copper Grade #1 Futures:
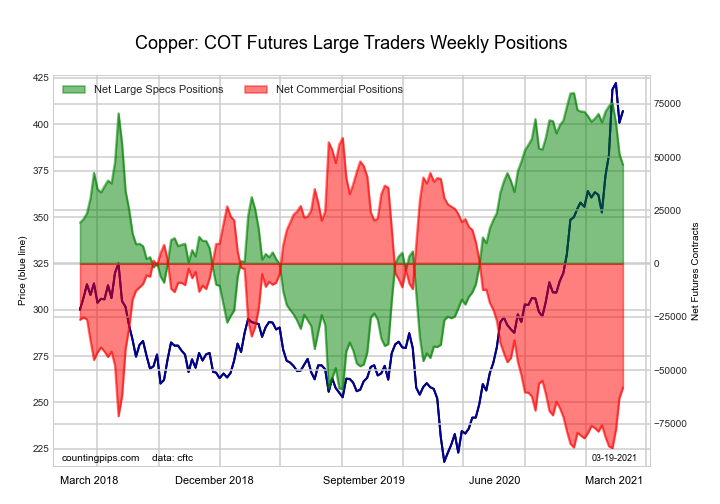
| Copper Futures Statistics | SPECULATORS | COMMERCIALS | SMALL TRADERS |
| – Percent of Open Interest Longs: | 45.5 | 30.4 | 9.6 |
| – Percent of Open Interest Shorts: | 26.2 | 54.6 | 4.7 |
| – Net Position: | 46,379 | -58,167 | 11,788 |
| – Gross Longs: | 109,118 | 72,841 | 23,134 |
| – Gross Shorts: | 62,739 | 131,008 | 11,346 |
| – Long to Short Ratio: | 1.7 to 1 | 0.6 to 1 | 2.0 to 1 |
| NET POSITION TREND: | |||
| – COT Index Score (3 Year Range Pct): | 75.8 | 19.5 | 100.0 |
| – COT Index Reading (3 Year Range): | Bullish | Bearish-Extreme | Bullish-Extreme |
| NET POSITION MOVEMENT INDEX: | |||
| – 6-Week Change in Strength Index: | -14.4 | 12.1 | 14.8 |
Platinum Futures:
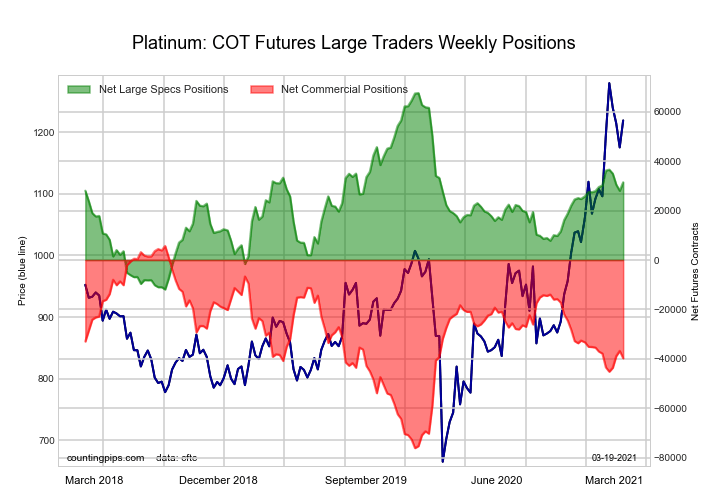
| Platinum Futures Statistics | SPECULATORS | COMMERCIALS | SMALL TRADERS |
| – Percent of Open Interest Longs: | 57.1 | 17.7 | 13.6 |
| – Percent of Open Interest Shorts: | 15.0 | 70.9 | 2.5 |
| – Net Position: | 31,443 | -39,773 | 8,330 |
| – Gross Longs: | 42,685 | 13,263 | 10,193 |
| – Gross Shorts: | 11,242 | 53,036 | 1,863 |
| – Long to Short Ratio: | 3.8 to 1 | 0.3 to 1 | 5.5 to 1 |
| NET POSITION TREND: | |||
| – COT Index Score (3 Year Range Pct): | 54.5 | 44.4 | 83.7 |
| – COT Index Reading (3 Year Range): | Bullish | Bearish | Bullish-Extreme |
| NET POSITION MOVEMENT INDEX: | |||
| – 6-Week Change in Strength Index: | 1.6 | -2.4 | 10.7 |
Palladium Futures:
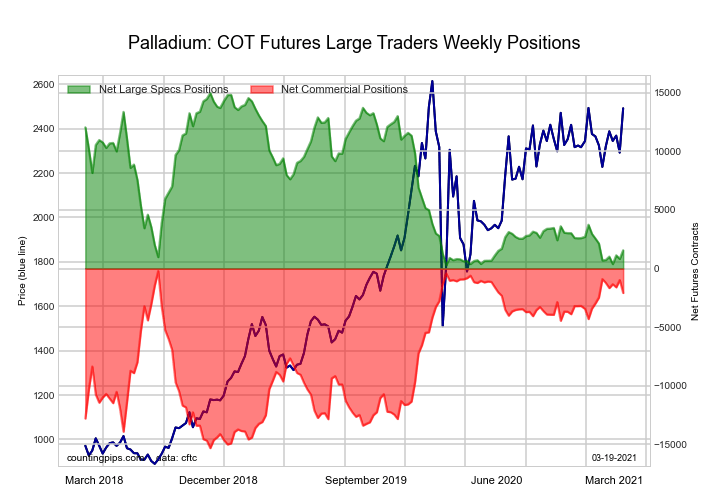
| Palladium Futures Statistics | SPECULATORS | COMMERCIALS | SMALL TRADERS |
| – Percent of Open Interest Longs: | 51.8 | 30.5 | 14.4 |
| – Percent of Open Interest Shorts: | 35.7 | 51.9 | 9.1 |
| – Net Position: | 1,562 | -2,077 | 515 |
| – Gross Longs: | 5,029 | 2,962 | 1,402 |
| – Gross Shorts: | 3,467 | 5,039 | 887 |
| – Long to Short Ratio: | 1.5 to 1 | 0.6 to 1 | 1.6 to 1 |
| NET POSITION TREND: | |||
| – COT Index Score (3 Year Range Pct): | 8.7 | 87.6 | 75.2 |
| – COT Index Reading (3 Year Range): | Bearish-Extreme | Bullish-Extreme | Bullish |
| NET POSITION MOVEMENT INDEX: | |||
| – 6-Week Change in Strength Index: | 5.9 | -7.8 | 18.8 |
Article By CountingPips.com – Receive our weekly COT Reports by Email
*COT Report: The COT data, released weekly to the public each Friday, is updated through the most recent Tuesday (data is 3 days old) and shows a quick view of how large speculators or non-commercials (for-profit traders) were positioned in the futures markets.
The CFTC categorizes trader positions according to commercial hedgers (traders who use futures contracts for hedging as part of the business), non-commercials (large traders who speculate to realize trading profits) and nonreportable traders (usually small traders/speculators).
Find CFTC criteria here: (http://www.cftc.gov/MarketReports/CommitmentsofTraders/ExplanatoryNotes/index.htm).

- COT Metals Charts: Weekly Speculator Bets led by Palladium Feb 1, 2025
- COT Bonds Charts: Speculator Bets led by SOFR 1-Month & Ultra 10-Year Bonds Feb 1, 2025
- COT Soft Commodities Charts: Speculator Bets led by Corn & Soybeans Feb 1, 2025
- COT Stock Market Charts: Speculator Bets led by S&P500 & Nasdaq Feb 1, 2025
- Trump confirmed plans to impose 25% tariffs on Canada and Mexico Jan 31, 2025
- Week Ahead: EU50 hits 24-year high ahead of Trump’s tariff showdown Jan 31, 2025
- Gold Hits Record High as Demand for Safe-Haven Assets Surges Jan 31, 2025
- The Bank of Canada and the Riksbank cut rates expectantly. The US Fed took a pause on interest rate cuts. Jan 30, 2025
- Market round-up: Big tech mixed, Fed holds, ECB next Jan 30, 2025
- EUR/USD Stable as the Market Absorbs Fed Decision and Awaits ECB Meeting Jan 30, 2025