Article By RoboForex.com
Analysis for April 11th, 2014
DJIA Index
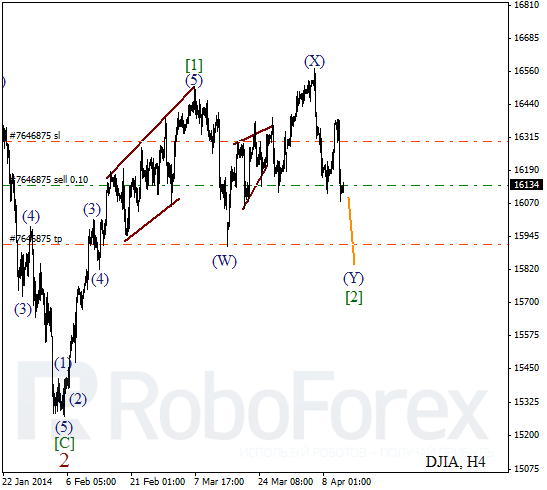
Index is still being corrected. Probably, price is forming double zigzag pattern inside wave [2] with descending wave (Y) inside it. Most likely, during the next several days instrument will break minimum of wave (W) and then start new ascending movement.
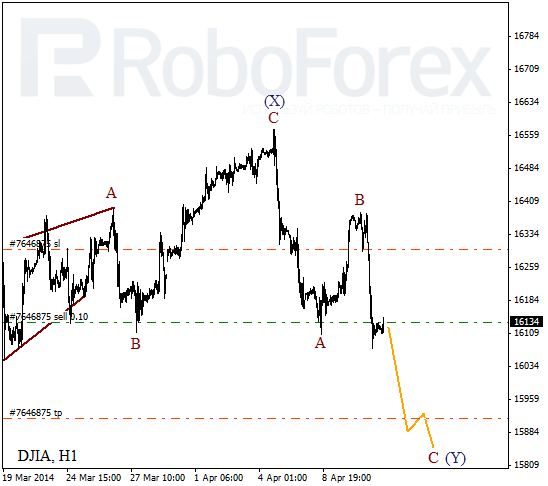
More detailed wave structure is shown on H1 chart. It looks like price is forming zigzag pattern inside wave (Y). On minor wave level, Index completed initial impulse inside wave C, which means that after local correction instrument may continue falling down.
Crude Oil
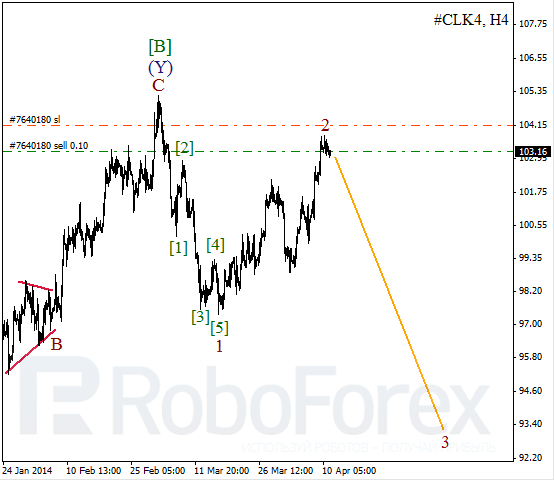
Forecast is still bearish. Earlier Oil finished bearish impulse inside wave 1 and right now is completing the second wave. While price was forming first initial impulses, I opened sell order. In the future, I’m planning to increase my short position.
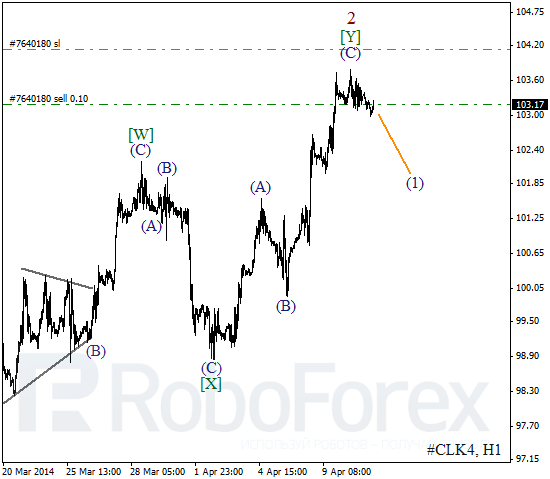
As we can see at the H1 chart, Oil completed zigzag pattern inside wave [Y]. Probably, price started forming bearish wave (1). I’ll move stop into the black as soon as market starts moving downwards.
RoboForex Analytical Department
Article By RoboForex.com
Attention!
Forecasts presented in this section only reflect the author’s private opinion and should not be considered as guidance for trading. RoboForex LP bears no responsibility for trading results based on trading recommendations described in these analytical reviews.